While such a figure makes for dramatic headlines, it obscures more relevant questions of how – or if – potential employment disruptions will occur. What types of jobs are most vulnerable to automation? What are the social and economic implications of future job losses from automation? What types of workers will be displaced, and what alternative employment are they qualified to pursue? What cities or towns will face greater impacts – and what specific occupations should they be concerned about?
To address such questions, Foresight Alliance has developed the Automation Impact Model. It builds on the occupational automation risk measures of Frey and Osborne and extends their automation risk assessments into new domains:
A forecast baseline using projected data. The core of the model is a baseline forecast for overall occupational growth from 2015 through 2035. Projected annual growth rates for each occupation are derived from the Bureau of Labor Statistics’ Employment Projections 2014–2024. While the BLS projections only run through 2024, this tool extrapolates the projections through 2035, across each of the 822 occupations tracked by BLS.
Additional data dimensions. The model applies additional related data, such as occupational education level, median salary information, socio-economic class categories, economic sector, and data about the localized concentration of occupations. (Further information about the data sources used can be found in the concluding Notes tab at the end of the visualizations).
New scales of analysis. The data model aggregates occupational employment data that is collected on three different scales: nationally, by state, and by metropolitan area. The model includes current and projected employment across all 822 occupations for the entire US, in all 50 states, and for all 421 individual metropolitan areas.
Interactive data exploration. Users can easily select, highlight, and filter the information to target items of interest. Quantitative information is presented in a visual context, simplifying the evaluation of relative importance.
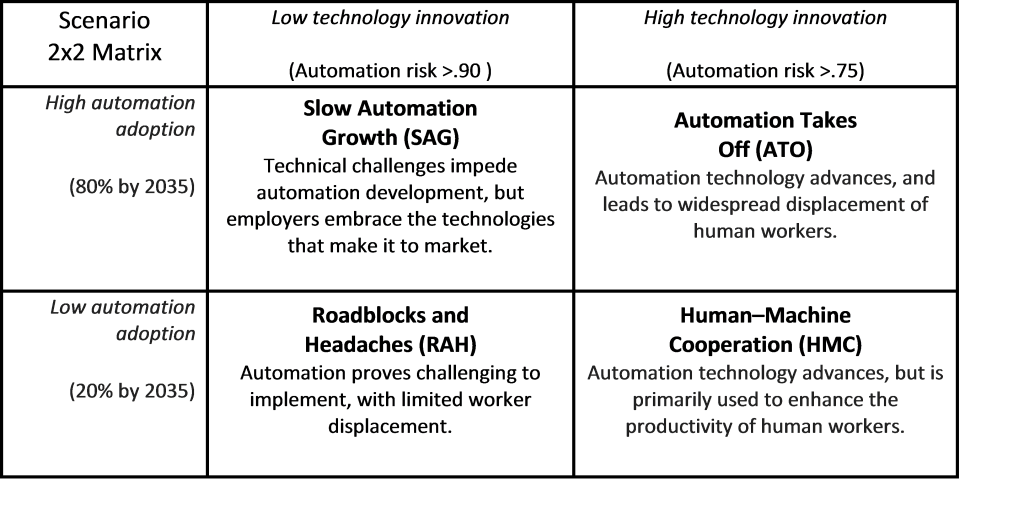
A scenario approach to automation risks. Instead of developing a single forecast for future automation impact, the model quantifies key variables into four scenarios and follows the future impact of each variable on automation risk.
Automation Scenarios: Two Key Uncertainties
The four model scenarios are defined by two key uncertainties:
- To what extent will technological innovation facilitate workforce automation? According to Frey and Osborne, High Automation Risk is defined as jobs with a 70% to 99% probability of being automated over the next two decades. Our scenarios set slightly more conservative thresholds for employment automation, assuming that the only jobs impacted by automation are those assigned at least a 75% (or 90%) probability of being automated by Frey and Osborne.
- To what extent will employers adopt new innovation technologies? Employment automation does not happen overnight – it is inevitably an incremental process. These scenarios use a product adoption growth curve (i.e., S-Curve) to forecast employers’ adoption of automation technologies, assuming an adoption rate of either 20% or 80% by 2035.
From these two sets of variables, we have quantified four different scenarios:
General observations from the Automation Impact Model
Automation risk is highly concentrated in jobs with a 90% and higher automation risk score. This means that automation risk is not heavily dependent on new innovations in automation technology. According to the model, the adoption rate of automation technology by employers is a greater driver of technological employment than technology innovation.
The scenarios with low levels of technology adoption are not necessarily implausible. Their relatively low levels of automation job loss are broadly similar to a recent OECD study on automation risk.
The jobs threatened by automation are among the most ubiquitous jobs in the US workforce. These jobs dominate automation job losses at nearly every scale and in nearly every region, because they are so commonplace. These commonplace jobs also have high automation risk scores, so they lead in job losses across all four scenarios. The top 10 automated jobs include:
- Retail salespersons
- Combined food preparation and serving workers, including fast food
- Cashiers
- Office clerks, general
- Laborers and freight, stock, and material movers, hand
- Waiters and waitresses
- Secretaries and administrative assistants, except legal, medical, and executive
- Heavy and tractor-trailer truck drivers
- Sales representatives, wholesale and manufacturing, except technical and scientific products
- Cooks, restaurant
Automation risk is highly concentrated among jobs with low pay and low educational prerequisites. The model uses the following income brackets to group workers by income:
- Professional Class: Above $100,000 median income
- Upper Middle Class: Between $67,500 and $100,000 median income
- Middle Class: Between $35,000 and $67,500 median income
- Working Class: Between $20,000 and $35,000 median income
- Working Poor: Below $20,000 median income
With only a few exceptions (accounting clerks, paralegals, etc.) college educated business professionals face minimal risks from job automation across all scenarios. The lower the wage, the more the risks of job automation escalate:
One caution: although the tool is built using recent data and uses documented assumptions about automation risks and future occupational growth, caution is warranted in assuming that the quantitative precision of current data can assuredly apply to future forecasts and scenarios. The scenarios are accurate extrapolations, given the base assumptions, but do not account for disruptive events or trends that could substantially alter the base assumptions. While they can be helpful in gaining a better understanding of the different dimensions of occupational automation risk, they should not be assumed to be forecasts of “the” future.
While some job categories will be automated out of general existence, new positions in entirely different job categories will be created. This is a more likely future state because it is historically the path that automation has followed.
I would really like to read more information with regards to your scenario development. Do you have a more detailed report available with this information?